Are you reaching your target audiences on the right social media platforms? One of the best ways to find out is to take a close look at your analytics.
Numbers can be difficult, but they are especially important in the PR and marketing industries. PR and marketing pros use numbers and data on a daily basis to evaluate how their content is doing, research their audiences, and make any tweaks to marketing/communications plan that are needed.
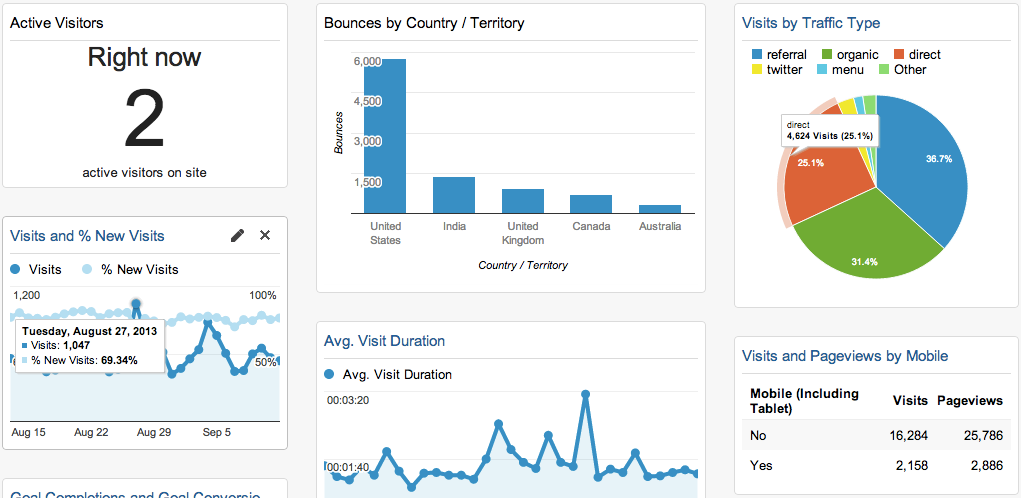
Let’s start with Google Analytics. Google Analytics is a great tool for discovering your audience members and how they interact and engage with your website. The tool offers insights into who is coming to your website, where they came from, what they do on your website, and if they make a purchase.

Here are a few key elements of Google Analytics:
- Audience – The audience overview gives you a high-level look at who the people coming to your website are. It provides the number of users, new users, sessions, pageviews, and bounce rate for a specified period of time. The Audience tab also allows you to take a look at active users, demographics, interests, and behavior.
- Acquisition – By clicking on the Acquisition tab, you will be able to see the top channels that people are coming to your website from —whether it is direct (meaning they typed in the URL), social, referral, or organic search. You can also see all traffic coming to your website or any campaign you have set up through Google Analytics or Google Adwords.
- Behavior – The Behavior tab allows you to understand how people are interacting with your website. The overview tells you the number of pageviews, average time on pages, and the bounce and exit rates. You can dig deeper into how each page is doing by going to the site content tab under behavior.
- Conversions – Conversions are the actions users take on your page, whether it is buying a product or turning a lead into a consumer. To access this data you need to set up measurable goals that matter to you and your business.
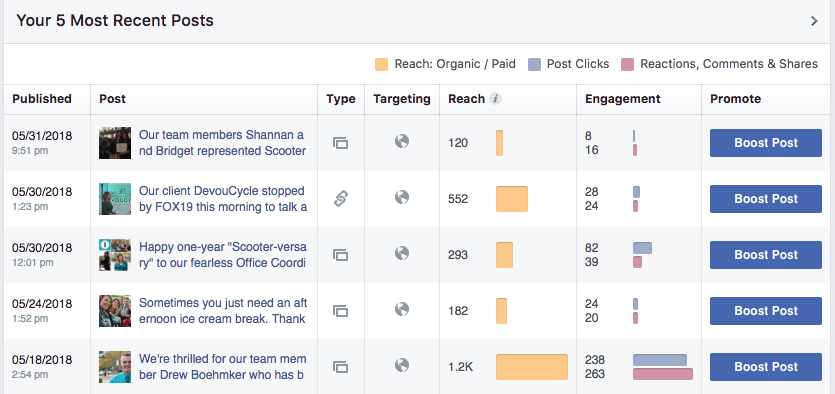
Another useful tool to help you learn about your audience is Facebook Insights. If your business has a page set up on Facebook, you have access to this tool. You can even take it a step further and set up a Business Manager page that will allow you to create advertising campaigns and see real-time analytics with ease. With Facebook Insights and Business Manager you will have access to information on who your audience is, how they respond to individual posts, when they are online, and more.

Here are a few Facebook Insights to keep an eye on:
- Overview – When you click on the Insights tab on your Facebook business page, the first thing that comes up is the overview. Here you can see your page’s summary for either yesterday, the last seven days, or the last 28 days. Information includes the number of actions on page, pageviews, page previews, page likes, reach, recommendations, post engagements, videos, and page followers. You can also export information for a more detailed Excel report.
- Likes and Followers – These tabs will allow you to see how many likes and followers your page has gained over a certain period of time. It also shows how many unlikes and unfollows, organic likes and followers, and net likes and follows your page had.
- Reach – The Reach tab allows you to see the number of people who had any post from your page appear on their screen. It also shows the difference in organic and paid reach.
- Posts – Posts will show you the times your audience is online, and will also show the reach, engagement, and promotion details for each post. If you click on the post, it will give you more specific information to analyze.
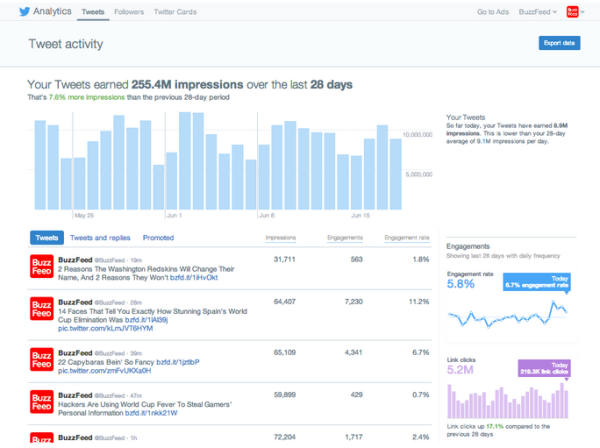
Twitter Analytics is similar to Facebook analytics in that it gives you insights into who your audience is, and has even more demographic information available than Facebook. It also has insights on engagement, impressions, and post data. There are even options for advertising on Twitter.

Here are a few items to look into from Twitter Analytics:
- Home – The home tab gives you a 28-day summary of your tweets and how they did compared to the previous period. You can look at the tweets, tweet impressions, profile visits, mentions and new followers of each month.
- Tweets – The tweets tab is similar to the posts tab on Facebook. It allows you to look at individual tweets and their impressions, engagements and engagement rate. It also allows you to see the engagement rate, link clicks, retweets, likes, and replies over a certain period of time.
- Audiences – Audiences gives you a detailed description of your Twitter followers from what their interests and consumer buyer styles are to household income, gender, and age. You can use this to compare your desired audience to your actual audience.
Take this information and learn who your audience is on each channel. Is it the same as your target audience? Do your messages resonate? Think about your marketing strategy and how to mix it up to reach who you want to. Meeting your consumers where they are is the best way to ensure success.
Scooter Media Is Your Social Media Resource
Scooter Media is your resource for navigating the ins and outs of the always-changing world of social media. Looking for more social media tips? Check out our primer on “The State of Social Media in 2018” along with our guides to scheduling your social media posts and delivering exceptional customer service experiences on Facebook. Also be sure to check back frequently for new installments of our “Social Media Snapshot” series!


